Allscreen
Addressing Internet Addiction by Tracking Total Screen Time

Overview
The Problem
The average adult spends 11 hours a day on a screen and prolonged use of screens can have negative health effects such as retina cell damage, disruption of circadian rhythm, obesity, and heart disease. Current screen time tracking apps do not provide a complete picture because trackers are limited to individual devices or devices with the same operating system.
The Solution
My team of 3 UX designers was tasked with creating a mobile concept solution to address internet addiction and to select a theoretical company sponsor to leverage the company’s branding and design system.
At the end of the 2-week sprint, my team designed Allscreen, an IoT solution that aggregates total screen time across all of a user’s devices by utilizing data from a user’s internet service provider (ISP) or by registering devices by IMEI number. Allscreen informs users of their screen usage habits and empowers lifestyle modification decisions to reduce screen time for better health.
My Role
Ideation, Prototyping, Usability Testing, Data Analysis
Team
Kate Wagner, Qiner Wang
Process

Discover
Defining the Target User: Screen-Focused Users
I learned through user interviews that users are aware (and sometimes feel guilty) of their screen usage and the potential health consequences but were uncertain of how much time they actually spend on screens. Users also expressed interest in finding substitute activities that could replace screen-based activities but were unsure of how to find these activities.
Target user behaviors and goals were defined through synthesis of these initial interviews:

Understanding the Screen Time Tracking Landscape
The team discovered screen time data visualization, usage data over time (week, month, etc.), and setting time limits are common features. Apps that track across devices only work for devices on the same platform, providing an opportunity to differentiate Allscreen.

Finding Inspiration in Comparative Tracking Apps
I also researched apps tracking utilities, finances, and exercise and discovered similar features to be standard:

Define
Leveraging Research Insights to Prioritize Features
User research and secondary research I conducted enabled the team to rank features as essential vs. nice to have and assess the expense and effort. The team determined the MVP needed to have most of the features categorized as essential, as well as non-screen activity suggestions and categorizing screen time based on user interview findings.

Technical Definitions
Allscreen was designed in iOS, therefore the team utilized Apple’s Human Interface Guidelines in the design process.
Develop
Involving Users Early to Make Design Decisions Supported by Feedback
I began ideating by sketching screen time data visualizations for the home screen and usage data over time screens to collect user feedback:
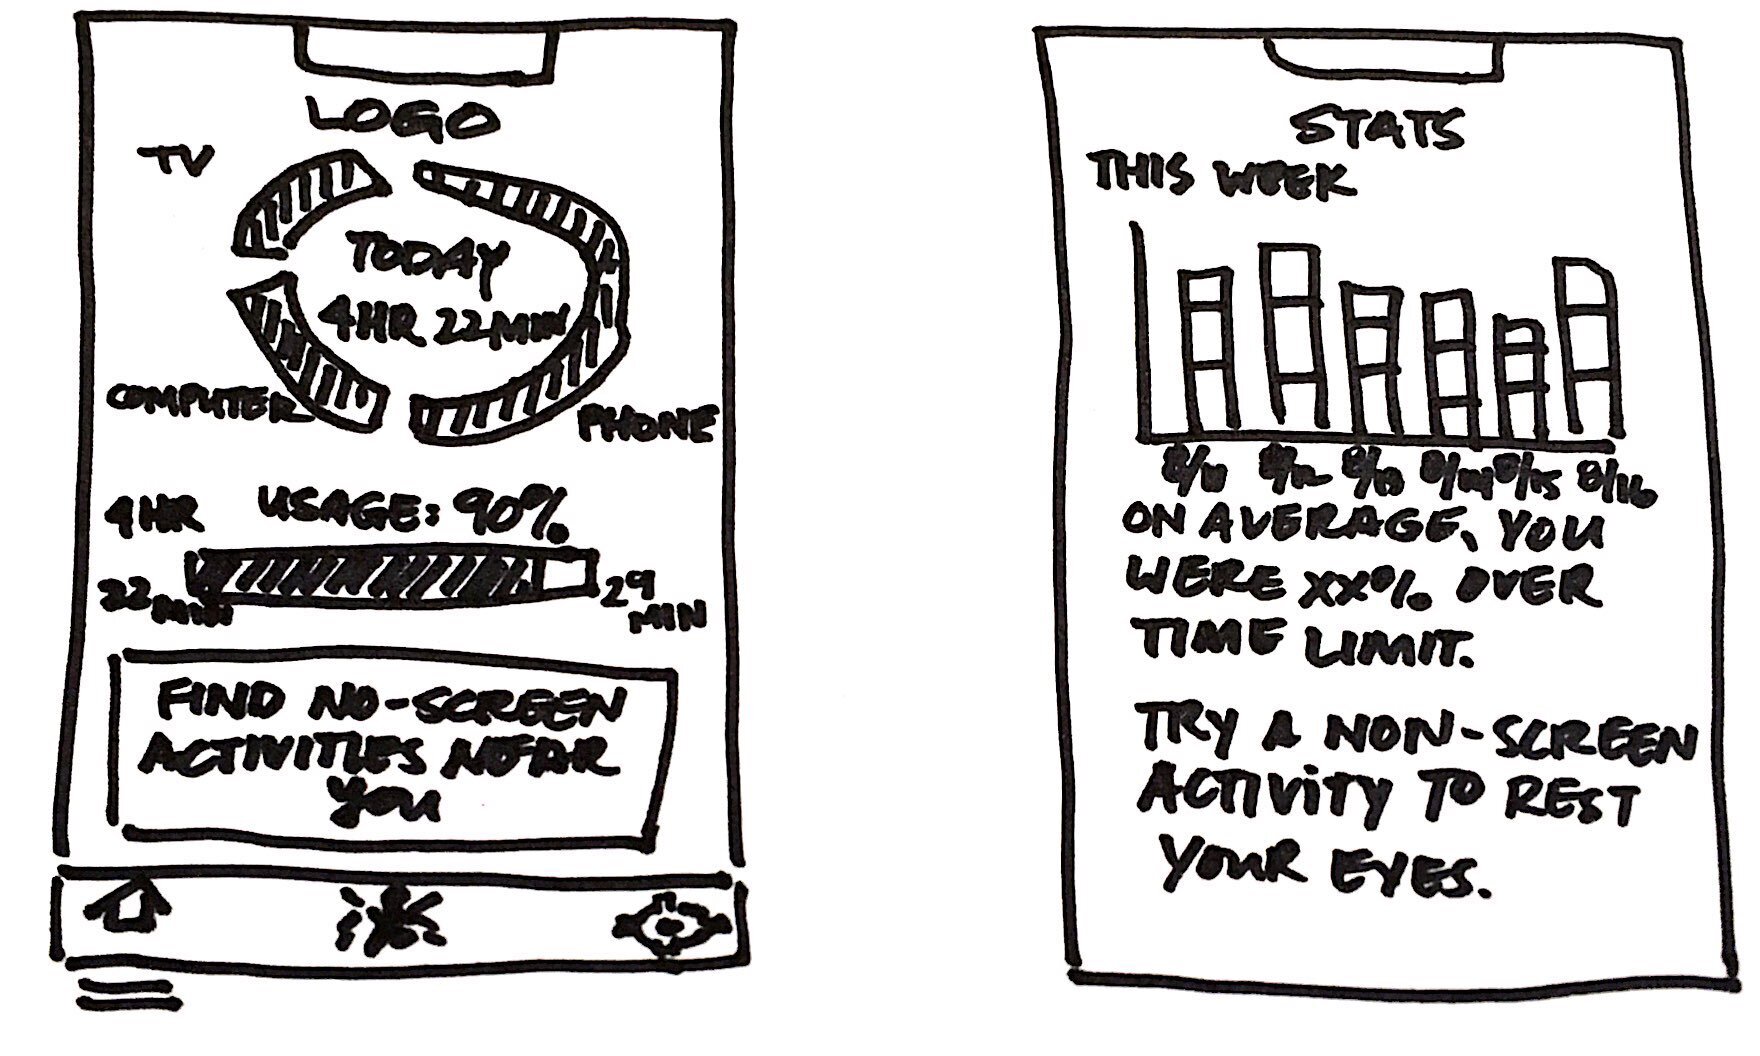
The user input received on the concept sketches informed design decisions for the wireframes and interactive prototype for usability testing.
Iteration #2: Replace Prescriptive Messaging with Usage Data by Device
“[I’m] not looking to make any drastic changes at the moment, but curious to see how I’m stacking up”
— User
Iteration #1: Prominent Placement of User’s Progress Toward Screen Time Goal
“I want the most simple way to stay on track…where it says ‘you have more time’ or ‘you don’t’ and that’s all”
— User


Validating Design Decisions and Identifying Potential Iterations Through Usability Testing
I formulated four usability test scenarios and tested the prototype with two users. Both users had 100% passing rate and rated Allscreen an adjusted score of 75 (out of possible 100) on the System Usability Scale (SUS). Through usability testing feedback, I identified further iterations the team incorporated into the high fidelity mockups.
Iteration #2: Reduce Penalty Clicks Needed to Find Alternative Non-screen Activities
Iteration #1: Increase Indicators of How Much of Screen Time Goal is Spent/Remaining


Deliver
Branding and Content Strategy
The team selected fitbit as our potential sponsor as Allscreen would align well with the company’s mission to support healthy living and empower users to achieve their goals. High fidelity mockups were inspired by fitbit’s colorful and impactful design system reflecting inspiration, encouragement, and fun.
From a business perspective, the Find Activities feature would be an opportunity to promote fitbit-sponsored workouts and provide a platform to advertise featured events and products.
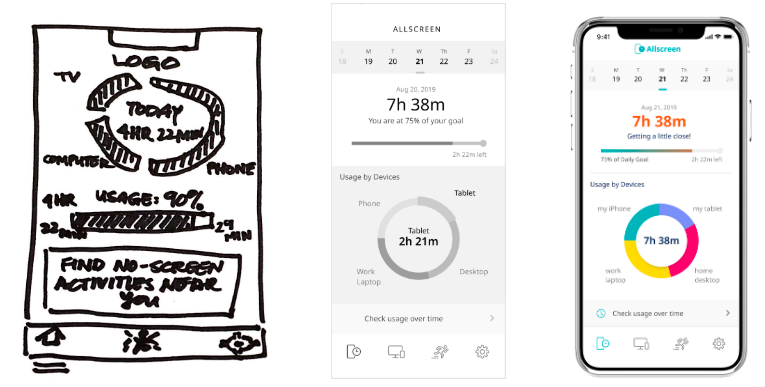
Evolution from Concept Sketch to Mockup
Home Screen
Screen Usage Data over Time

Final Mockups
Splash Screen and Onboarding
Connect ISP and Add Devices


Finding Nearby Non-screen Activities
Viewing Usage Data Over Time


Conclusion
At the end of our 2-week sprint, my team was able to create a forward-thinking, easy to use, and informative solution to approach a serious social issue. Although Allscreen’s feasibility is limited by the current IoT landscape, the possibility exists that this strategy to gather aggregated screen time can be feasible in the near future.
If I was to take this project further, my next step would be to enable users to distinguish between “productive” and “non-productive” screen time (i.e. computer screen time at work vs. playing games while commuting) to help users better discover opportunities throughout the day to reduce screen time.